

South Park Condo Market Snapshot March 2026 By Michael Robleto, Realtor @ Compass
The South Park condo market continues to move slowly as inventory remains elevated and transaction volume stays thin. This monthly column tracks key metrics within the South Park BID boundary to provide a consistent view of supply, pricing, and buyer activity in the neighborhood.
All data is sourced from the MLS and includes only condominium buildings located within the South Park Business Improvement District.
About the Author
This report is compiled by Michael Robleto, a South Park resident and real estate broker with Compass who specializes in downtown Los Angeles condominium buildings and loft properties. Michael has lived in South Park since 2009 and closely tracks neighborhood sales data, pricing trends, and building-specific market activity.
The goal of this column is to provide a clear, data-driven snapshot of the local condo market each month for residents, buyers, and owners interested in how the neighborhood is performing.
CHART 1
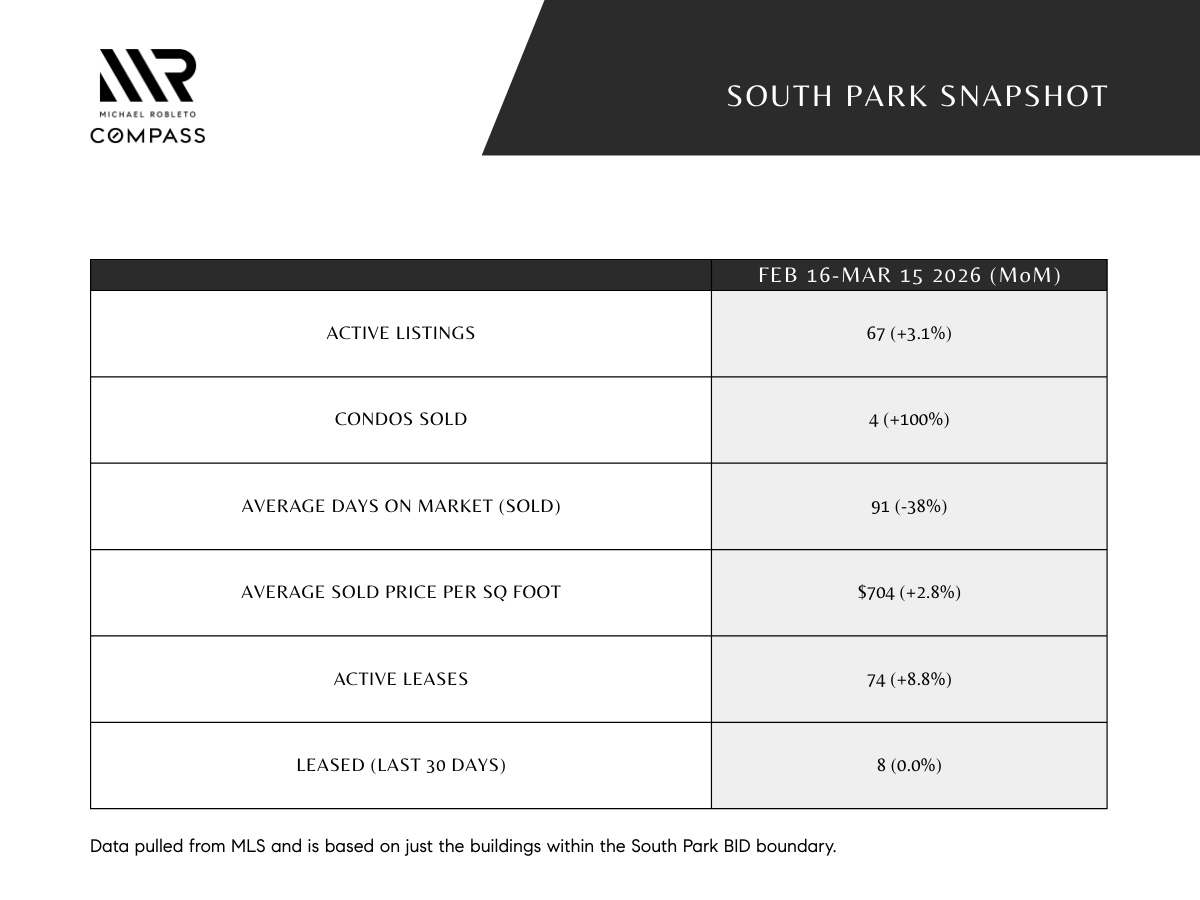
Inventory increased slightly from last month, rising from 65 to 67 active listings. Sales activity improved modestly with four closings during the reporting period compared with two in the previous snapshot.
Average days on market dropped meaningfully from 149 days to 91 days, suggesting that units priced correctly are continuing to attract buyers even in a slower environment. This is a solid indication that the Spring selling season is upon us.
Pricing Trends
The average sold price per square foot for the period was $704, up slightly from $685 in the previous report.
Because the South Park market often sees only a handful of monthly sales, price per square foot can move meaningfully based on the mix of units that close. A larger or higher-end unit can move the monthly average significantly.
Looking at the broader trend, pricing has largely held within a relatively stable range over the past two years, typically between the mid-$600s and mid-$700s per square foot.
The chart below tracks the median sold price per square foot by month since early 2024.
CHART 2
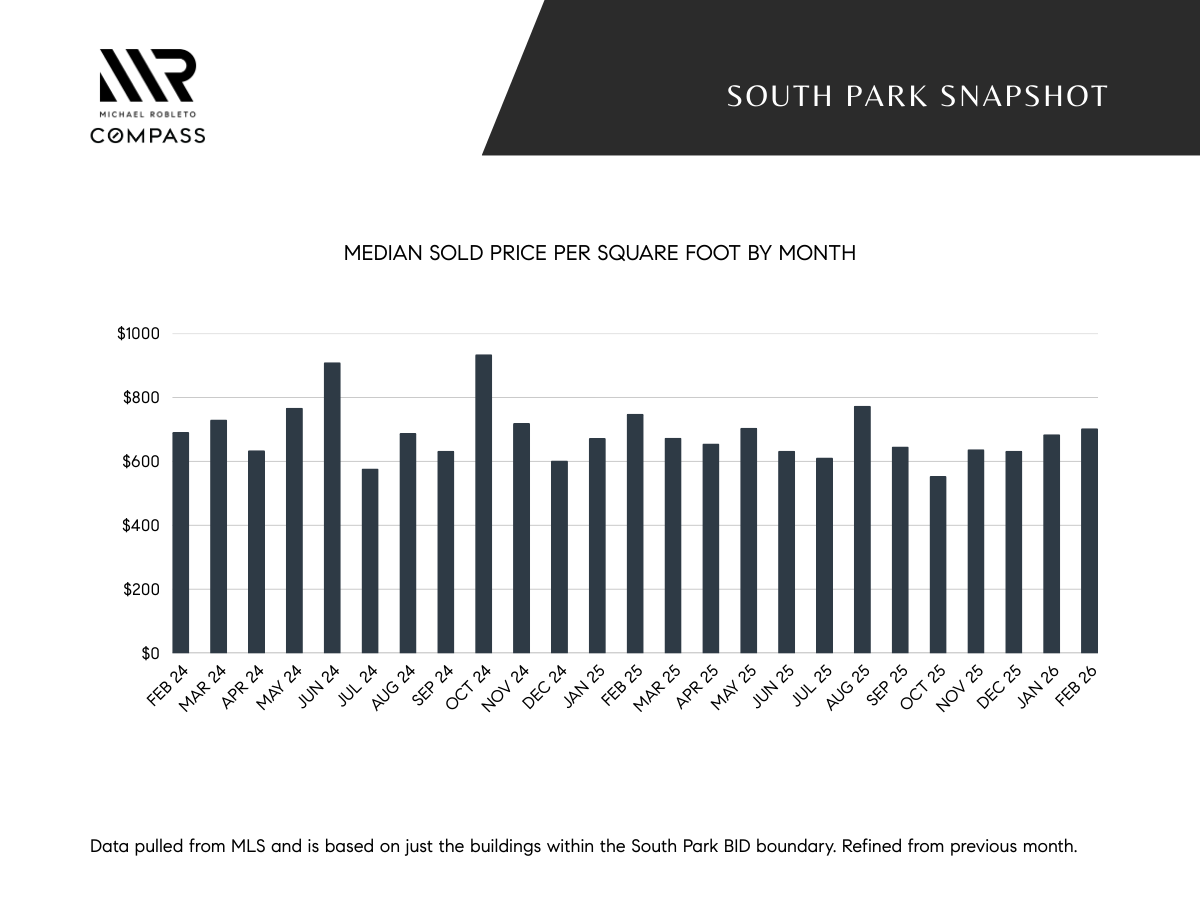
While individual months can spike when premium units close, the overall trend shows that pricing in South Park has remained relatively steady despite slower transaction volume.
Market Interpretation
The current snapshot points to a market that is active but selective.
Inventory remains elevated, giving buyers a broad range of choices. At the same time, the drop in average days on market suggests that well-priced units are still able to secure buyers.
Sales volume remains the primary constraint. With only a small number of closings each month, market statistics can shift quickly based on just one or two transactions.
This dynamic is typical for South Park, where the condo market is relatively small compared with larger downtown submarkets.
Looking Ahead
As we move into the spring selling season, the key metrics to watch will be:
Transaction volume — whether monthly sales begin to increase
Inventory levels — whether new listings continue to add supply
Price stability — whether the current $650 to 750 PPSF range holds
If sales activity increases while inventory remains steady, the market could begin to tighten slightly heading into the summer.
Next month’s report will provide an updated look at how these trends develop.